
Final Report Prepared for
Los Angeles City Plaza, LP
Prepared by
Baker Tilly US, LLP
May 2023
Baker Tilly US, LLP trading as Baker Tilly is a member of the global network of Baker Tilly International Ltd., the members of which are separate and independent legal entities.
©2023 Baker Tilly US, LLP
![]()
Executive Summary 2
1-1. Introduction 4
Methods & Assumptions 6
2-1. Assumptions 6
2-2. Simulation Inputs 7
2-3. RIMS II Final Demand and Employment Multipliers 12
2-4. Calculation of Employment Results Using Final Demand Multiplier 12
2-5. Effect of Household Earnings, Demand for Business Services, Utilities, Maintenance and Construction, and New Supplier/Vendor Relationships with Manufacturers 14
2-6. Verification of Inputs 15
![]()
This economic analysis report, utilizing RIMS II, was prepared to evaluate the economic impacts of a specific project located within the Los Angeles-Long Beach, California Combined Statistical Area (“CSA”), which is being developed under the sponsorship of the approved California Investment Regional Center, LLC. The project involves the development and operation of a 4- story mixed-use building with 36 units of residential condominiums, 10,000 square feet (SF) of retail/restaurant space subdivided into 5 units on the 1st floor, and underground parking. The retail portion will feature a coffee shop at unit 101 (1,845 SF) and full-service restaurant (3,781 SF) at units 102 and 103, both of which will be owned and operated by the JCE. Units 104 and 105 will be sold for retail or restaurant use by new owner(s).
The project is located at 1570, 1580 and 1598 Long Beach Blvd, Long Beach, California. This project’s activities are collectively referred to as the “Long Beach Garden Homes Project” or (the “Project”).
The Project will increase investment in the region by a one-time amount of $37,570,000. This impact analysis finds that the project will generate significant and positive economic benefits for the regional economy.
A total of 383.7 new jobs will be created from the construction and operation of the Project.
The Project would result in annual growth in the regional economy by a gain of
$25,573,000 in regional household earnings.
The regional economy will experience increased need for business services of
$4,643,000.
The regional economy will experience annual increased demand on utilities of $926,000.
The regional economy will experience an increased demand for maintenance and construction of $25,927,000.
The regional economy will experience increased demand on new supplier and vendor links with manufacturers of $7,239,000.
The estimated EB-5 capital to be raised is $12,000,000 from 15 new EB-5 investors at the $800,000 investment level. To date, 12 EB-5 investors are currently subscribed to the Project at $500,000 each, totaling $6 million. The estimated 27 individual investors in the project would be assigned 14.4 jobs each. The project provides enough jobs to meet the requirements of the EB-5 program.
EB-5 rules outlined in the EB-5 Reform and Integrity Act of 2022 state that the project can satisfy only up to 90% of total required jobs created indirectly. The EB-5 Reform and Integrity Act of 2022 also allows for the inclusion of economically and statistically valid mythologies for determining the number of jobs created directly by the project using capital expenditures and revenues generated. The Project anticipates up to 15 new investors pooling $12,000,000 in target EB-5 funds. Of the 150 required jobs for new investors, only 135 may be created indirectly and 15 must be direct jobs. Based on this economic analysis, the Project is anticipated to create 383.7 jobs of which 198.0 of the jobs are model derived direct jobs. 120 jobs will be allocated to existing investors, leaving
263.7 estimated to be available to new investors. Therefore, the Project meets the requirements of the EB-5 program.
The following chart summarizes the total permanent new jobs that will be created from the development and operation of the Project. These figures assume that the expenditures/revenues for the Project given in the table are met.
Table A. Summary of Projected Employment for the Long Beach Garden Homes Project | ||||||
Project (with NAICS Code) | Expenditure/Revenue (Current Dollars) | Expenditure/Revenue (2020 Dollars) | RIMS II Final Demand Multiplier | Total Number of New Direct Jobs Created | Total Number of New Indirect Jobs Created | Total Number of New Permanent Jobs Created |
Non- Residential Building Construction (NAICS code 2362) | $28,169,538 | $25,608,671 | 13.9403 | 182.3 | 174.7 | 357.0 |
Furniture, Fixtures and Equipment Purchases (NAICS code 4232, 4234 and 4236) | $510,244 | $395,538 | 5.7226 | -- | 2.3 | 2.3* |
Architectural, Engineering and Related Services (NAICS code 5413) | $321,483 | $300,451 | 12.1691 | 1.5 | 2.2 | 3.7 |
Restaurants and Other Eating Places (NAICS code 7225) | $1,203,574 | $1,065,110 | 19.4267 | 14.2 | 6.5 | 20.7 |
Grand Total: | 198.0 | 185.7 | 383.7 | |||
*Indirect Jobs Only
![]()
Baker Tilly US, LLP (“BT”) has been retained by Los Angeles City Plaza, LP (Job Creating Entity or the “JCE”) to perform an economic assessment of a planned investment in the construction and operation of a project located within the state of California. The following industry clusters were analyzed as part of this project:
Non-Residential Building Construction – NAICS 2362
Furniture and Home Furnishing Merchant Wholesalers – NAICS 4232
Professional and Commercial Equipment and Supplies Merchant Wholesalers – NAICS 4234
Household Appliances and Electrical and Electronic Goods Merchant Wholesalers – NAICS 4236
Architectural, Engineering and Related Services – NAICS 5413
Restaurants and Other Eating Places – NAICS 7225
California Investment Regional Center, LLC is an approved EB-5 regional center with a geographic area encompassing Los Angeles and Orange Counties in California.
The sphere of influence for the Project will be the following counties in California: Los Angeles, Orange, Riverside, San Bernardino and Ventura. This area is otherwise known as the Los Angeles-Long Beach, CA, CSA. The specific location of the project is economically integrated and located within the approved regional center and has been defined as the project region. Based on information provided by the developer, BT performed an analysis for the target industry economic cluster in the proposed project specific geographic area. RIMS II was utilized.
BT used RIMS II to model the total economic impact associated with various levels of site investment and operational employment. To quantify the net economic impact (direct and indirect) of the development, RIMS II modeled the following effects:
Direct and indirect effects of construction employment, household earnings, and output
Direct and indirect effects of operational employment, household earnings, and output
BT examined the project data provided by the JCE using a multi-industry sector, segregated- region model. Using this model, BT was able to develop independent forecasts for the proposed use of the project. This segregation of forecasts allowed BT/RIMS II to capture the total net effects of the proposed target industry. By analyzing the regional developments with different underlying assumptions for the specific industries, BT established a realistic prediction of a potential outcome.
The RIMS II economic model employed for the economic and job creation impact assessment study, forecasts the economic impact a specific event will generate throughout a determined area – the Los-Angeles-Long Beach CA CSA. Over time, competitive pressures emerge and then tend to revert back to equilibrium. The process, in that way, depicts the so-called "ripple- effect" impacts economic changes have on a region.
In this case, the initial economic stimulation reverberates through the economy spreading outward from the site of the new investment and business activity and across the geographic region and the nation. Eventually the new waves of the economic activity are absorbed into the larger economy creating a new level of economic equilibrium. In the long run, the project will materially alter the geographic area by the substantial amount of new investment and related business development activities, including a corresponding higher level of output, taxation, investment, employment, and household earnings in the regional economy. This report is intended to demonstrate the increased economic impacts within the geographic region.
![]()
![]()
For the project, BT examined the economic effects of site development and operations. BT systematically reviewed each set of assumptions used to properly customize the sector outputs that make up the set matrices. In the following assumptions, BT applied specific sector data resulting in a very detailed, realistic, and logical range of likely outcomes.
The tables within this analysis show the expected spending as well as increases in employment and household earnings for ongoing operations.
The definition of “direct jobs” through RIMS II used in this report should not be confused with the concept of “direct job” creation measurable by Forms I-9, payroll records or other similar documentation as set forth in 8 C.F.R. § 204.6(j)(4)(i)(A). That section contemplates individually identifiable “direct hire” type jobs created which can individually identify the actual employees of the Job Creating Entities (JCE), most often in the non-regional center context.
When economists use the term “direct” jobs in the context of an econometric methodology such as RIMS II, what is meant are jobs created directly by revenues (which in the EB-5 Immigrant Investor Program results from an immigrant investor’s investment). For example, where a regional center-based new commercial enterprise comprised of immigrant investors renovates a building it purchases, the employees of the various unaffiliated tenants of that building would be considered “direct” jobs in the context of an econometric report. However, as noted in USCIS’ stated EB-5 policy, those jobs are not “direct” in the sense set forth in 8 C.F.R. § 204.6(j)(4)(i)(A) where the new commercial enterprise is itself the employer that can provide Form I-9 or other similar documentation on its own employees. The tenants’ employees are not “direct” employees of the regional center-based new commercial enterprise, nor may they be counted for other job creation credit calculations “unless” the tenant jobs were not pre-existent somewhere else, and merely were existing jobs transferred to the new tenant location from a prior location where they had existed.
To be clear, this report does in fact also set forth the number of EB-5 “direct” jobs that are likely to be created by the JCE and that by the point of filing to remove conditions by way of the Form I-829 process, the JCE will be fully compliant with 8 C.F.R. § 204.6(j)(4)(iii) in providing probative evidence for the proof of “direct” EB-5 job creation. In addition, and within the context of regulations which apply particularly to regional centers, for calculation of the resultant and newly induced and indirect job creation, it is not Forms I-9, payroll records or similar documentation that will be the needed to meet the USCIS’ preponderance of evidence standard, but rather “reasonable methodologies” such as used for this report.
![]()
A summary of the Project follows:
Long Beach Garden Home Project – the project involves the development and operation of a 4-story mixed-use building with 36 units of residential condominiums, 10,000 square feet (SF) of retail/restaurant space subdivided into 5 units on the 1st floor, and underground parking. The retail portion will feature a coffee shop at unit 101 (1,845 SF) and full-service restaurant (3,781 SF) at units 102 and 103, both of which will be owned and operated by the JCE. Units 104 and 105 will be sold for retail or restaurant use by new owner(s).
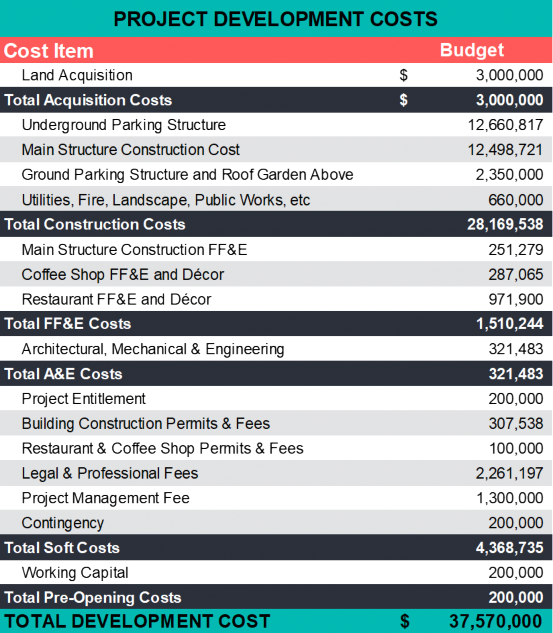
The total hard construction costs will total $28,169,538 (in current dollars). The current RIMS II multipliers are from 2020 therefore we must deflate the expenditures to 2020 Dollars.
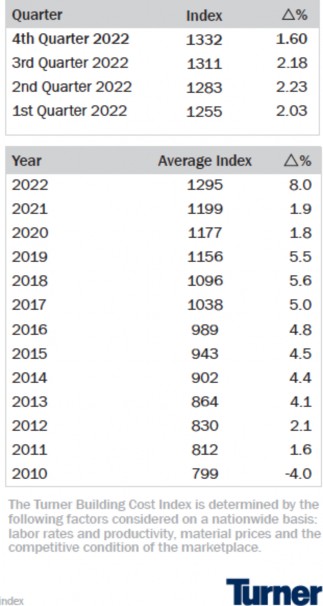
According to the Turner Construction Building Cost Index, the cost index in 2020 was 1177 versus the 2022 cost index of 12951. Therefore, the construction costs for this project will need to be further reduced to reflect 2020 Dollars.
![]()
1 http://www.turnerconstruction.com
To convert this figure to 2020 Dollars we use the average 2022 cost index of 1295 and divide it by the 2020 cost index of 1177. This gives us a figure of 1295/1177 = 1.10. To convert the expenditure in current dollars to 2020 Dollars, the expenditure is divided by 1.10.
Non-Residential Building Construction Expenditure Current Dollars vs. 2020 Dollars | |
Current Dollars | 2020 Dollars |
$28,169,538 | $25,608,671 |
Construction employment was derived through expenditure modeling based upon detailed construction cost figures provided by the JCE. Verification at the I-829 stage of the EB-5 process would be receipts, tax documents, and other expense records.
The total expenditure for FF&E purchases will total $510,244 (in current dollars).
To convert this figure to 2020 Dollars we use the average Producer Price Index (PPI) for merchant wholesalers, which is 193.1 and divide it by the 2020 PPI of 149.7. This gives us a figure of 193.1/149.7 = 1.29. To convert the $510,244 in current dollars to 2020 Dollars, the expenditure is divided by 1.29, to yield $395,538.
FF&E Expenditure Current Dollars vs. 2020 Dollars | |
Current Dollars | 2020 Dollars |
$510,244 | $395,538 |
Expenditure into the wholesale trade industry that was used as input to the RIMS II model was provided by the JCE. Verification at the I-829 stage of the EB-5 process would be verification of expenditure based upon receipts, tax documents, and other expense records.
The total EB-5 eligible architectural and engineering services costs will total $321,483 (in current dollars).
To convert this figure to 2020 Dollars we use the average Producer Price Index (PPI) for architectural, engineering and related services, which is 182.5 and divide it by the 2020 PPI of
170.6. This gives us a figure of 182.5/170.6 = 1.07. To convert the $321,483 in current dollars to 2020 Dollars, the expenditure is divided by 1.07, to yield $300,451.
A&E Expenditure Current Dollars vs. 2020 Dollars | |
Current Dollars | 2020 Dollars |
$321,483 | $300,451 |
Expenditure into the architectural and engineering industry that was used as input to the RIMS II model was provided by the JCE. Verification at the I-829 stage of the EB-5 process would be verification of expenditure based upon receipts, tax documents, and other expense records.
The revenue will total $17,370,693 (in current dollars) by the first year of operations. This includes $754,872 in revenue from the Chinese Restaurant and $448,702 in revenue from the Coffee Shop.
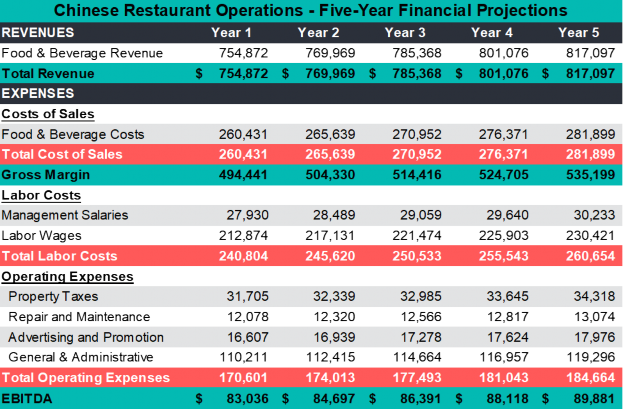
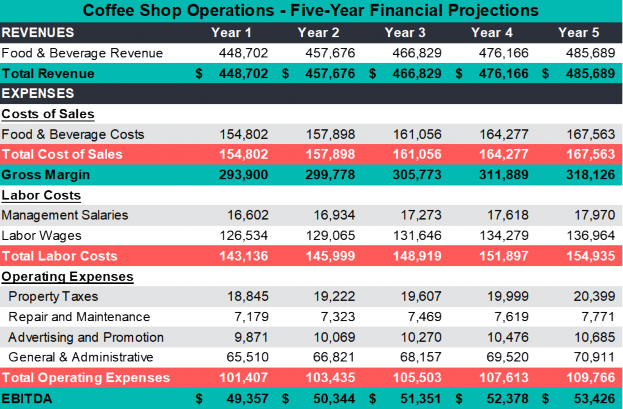
To convert this figure to 2020 Dollars we use the average Consumer Price Index (CPI) for food away from home, which is 330.8 and divide it by the 2020 CPI of 293.9. This gives us a figure of 330.9/293.9 = 1.13. To convert the $1,203,574 in current dollars to 2020 Dollars, the revenue is divided by 1.13, to yield $1,065,110.
Food and Beverage Revenue Current Dollars vs. 2020 Dollars | |
Current Dollars | 2020 Dollars |
$1,203,574 | $1,065,110 |
Revenue into the food services industry that was used as input to the RIMS II model was provided by the JCE. Verification at the I-829 stage of the EB-5 process would be tax returns and other financial statements.
![]()
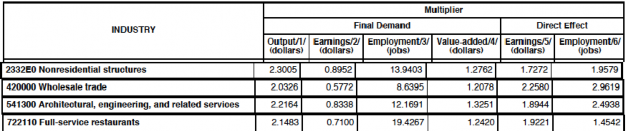
Shown in the chart below are the actual RIMS II final demand and employment multipliers used in the project for this analysis specific for the counties within the project region.
![]()
For non-residential construction (NAICS code 2362), the final demand multiplier is 13.9403 and the employment multiplier is 1.9579. The final demand multiplier is used to determine the total number of jobs produced based on the expenditures for non-residential construction of the project, which is shown in Table A of this report. This figure is $25.609 million (in 2020 Dollars). Therefore, if all the jobs were counted, there would be $25.609 times 13.9403, or 357.0 jobs. This figure includes direct and indirect jobs.
Project construction is scheduled to take over two years therefore we can count direct jobs from the construction expenditure.
The employment multiplier is 1.9579, which means that for every 1 direct job, there are 1.9579 total jobs. Hence, for every 1 direct job, there are 0.9579 indirect jobs. If there are a total of
357.0 jobs if all categories are counted, then based on this multiplier, there are 182.3 direct jobs and 174.7 indirect jobs. This is the figure shown in Table A.
For NAICS codes 4232, 4234 and 4236 (Furniture and Home Furnishings Merchant Wholesalers, Professional and Commercial Equipment and Suppliers Merchant Wholesalers and Household Appliances and Electrical and Electronic Goods Merchant Wholesalers), the final demand multiplier is 8.6395 and the employment multiplier is 2.9619. The final demand multiplier is used to determine the total number of jobs produced based on the purchases of FF&E for the project, which is shown in Table A of this report. This figure is $0.396 million (in 2020 Dollars). Therefore, if all the jobs were counted, there would be $0.396 times 8.6395 or 3.4 jobs. This figure includes direct and indirect jobs.
FF&E purchases are a one-time event; therefore, we can only count indirect jobs from the purchases. The employment multiplier of 8.6395 must be reduced (or have the direct effects taken out) to reflect indirect impacts only.
The final demand multiplier of 8.6395 is divided by the employment multiplier 2.9619 to yield 2.9169. This figure reflects the direct effects only; therefore, we then subtract 2.9169 from 8.6395, which gives us the indirect final demand multiplier of 5.7226.
The indirect multiplier of 5.7226 is then multiplied by the expenditure of $0.396 to produce a total number of indirect jobs of 2.3. This is the figure shown in Table A.
For NAICS code 5413 (Architectural, Engineering and Related Services), the final demand multiplier is 12.1691 and the employment multiplier is 2.4938. The final demand multiplier is used to determine the total number of jobs produced based on the architectural and engineering services for the project, which is shown in Table A of this report. This figure is $0.300 million (in 2020 Dollars). Therefore, if all the jobs were counted, there would be $0.300 times 12.1691, or
3.7 jobs. This figure includes direct and indirect jobs.
Architectural and engineering services will last over two years therefore we can count direct jobs from the expenditure.
The employment multiplier is 2.4938, which means that for every 1 direct job, there are 2.4938 total jobs. Hence, for every 1 direct job, there are 1.4938 indirect jobs. If there are a total of 3.7 jobs if all categories are counted, then based on this multiplier, there are 1.5 direct jobs and 2.2 indirect jobs. This is the figure shown in Table A.
For NAICS code 7225 (Restaurants and Other Eating Places), the final demand multiplier is 19.4267 and the employment multiplier is 1.4542. The final demand multiplier is used to determine the total number of jobs produced based on the revenue for NAICS code 5311, which is shown in Table A of this report. This figure is $1.065 million (in 2020 Dollars). Therefore, if all the jobs were counted, there would be $1.065 times 19.4267, or 20.7 jobs. This figure includes direct and indirect jobs.
The employment multiplier is 1.4542, which means that for every 1 direct job, there are 1.4542 total jobs. Hence, for every 1 direct job, there are 0.4542 indirect jobs. If there are a total of 20.7 jobs if all categories are counted, then based on this multiplier, there are 14.2 direct jobs and
6.5 indirect jobs. This is the figure shown in Table A.
![]()
The economic impact as measured by household earnings, demand for business services, utilities, maintenance and repair, and new supplier and vendor relationships is summarized in the chart below.
Summary Measures of Economic Impact for the Project | |
Total Household income from: | |
Construction | $22,925,000 |
FF&E Purchases | $109,000 |
A&E Services | $250,000 |
F&B Operations | $2,289,000 |
Total the above categories | $25,573,000 |
Demand (output) for: | |
Professional and business support services | $4,643,000 |
Utilities | $926,000 |
Maintenance and repair construction | $25,927,000 |
Supplier/vendor links with manufacturers | $7,239,000 |
Total these 4 categories | $38,735,000 |
The jobs created by the various components of the project will subsequently create new sources of household income. The total household income from the project will be approximately $25.57 million. This income calculation comes from the RIMS II input-output model, which measures the average income per job by industry. The model calculations are based on the types of jobs that will be created within the regional center, with indirect impacts allocated based on the types of commodity inputs required by the businesses that would potentially locate in the regional center.
The total economic impact of the project from the supplier purchases and business relationships for the regional center will create approximately $38.74 million in additional economic activity across the region. These supplier purchases are calculated from the indirect increase in output generated by the RIMS II model. It should be noted that some of these supplier industries might potentially locate within the regional center, and their economic output is included in this total.
The estimate of supplier purchases is based on the commodity data in the RIMS II input-output model. This data specifies the amount and type of commodity input needed to maintain specific types of business operations. The model estimates the supplier purchases based on the types of jobs and number of jobs that will be created within the regional center. In addition, the model allocates the supplier purchases to businesses within the region, based on trade flow data from the U.S. Bureau of Economic Analysis.
The regional center will create demand for business services including, professional services and business services and support services. The impact of this activity totals $4.64 million annually.
Utilities include services such as electricity, natural gas, and water and sewer facilities. The economic impact on utility services totals $0.93 million.
Maintenance and repair services include some building and construction activity on existing buildings. The regional center would create an economic impact of $25.93 million within these sectors in the region. Because most of the construction activity is either upfront during building construction or integrated into repair and maintenance services, the economic impact for construction sectors is minimal on an ongoing basis.
New supplier/vendor relationships with manufacturers would create an economic impact of
$7.24 million. These activities include purchases of locally manufactured goods plus purchased materials for construction, plus any locally produced materials used in food services.
![]()
Please see Business Plan for verification of all development costs and revenue projections.
© 2023 Baker Tilly US, LLP